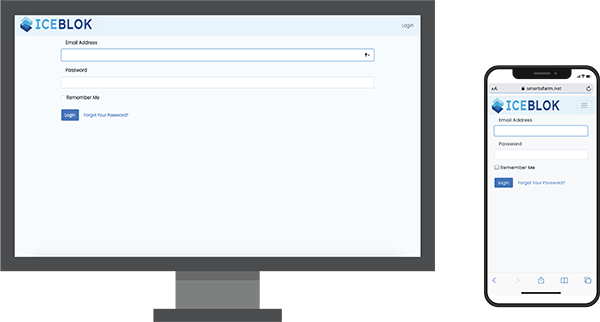
Logging in to the Smarta Farm account is incredibly simple. Head to https://www.smartafarm.net to login. Note: we recommend you select remember password on both your desktop and any mobile devices for ease of access each time you log in. It is also a good idea to bookmark the login URL so that it is simple and easy to find.
The Portal is designed for easy use and can be accessed on all desktop and mobile devices, and all browsers. Once logged in, you can easily acccess the full portal (note: depending on what access level your account is).
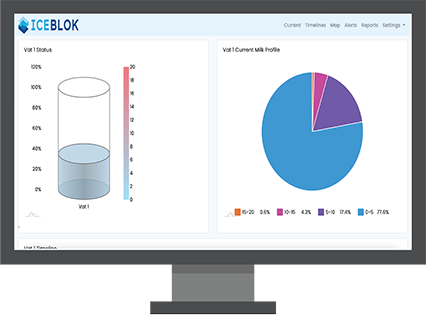
When you login by default, it will take you to the snapshot of the current Vat status. Anything highlighted in red indicates that the data is out of date. If an alert is present, it will also show on this screen. This main interface allows you to tab through Vat Status, Lab Results, Milk, CIP, Heat and Weather data.
The current tab will only show what is currently available in the Vats. Once they have been cleared, that information will then be available in the reports section.
You can also complete a keyword search to bring up a particular result or asset in any one of those main tabs.
General navigation is quite simple. Once you log in all of the tabs along the top of the screen allow you to easy tech your desired page. The settings tab on the far right provides more detailed and setup options as well as the log off button.
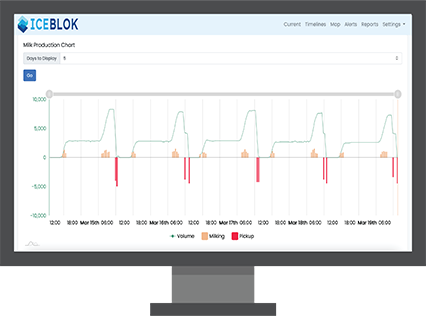
Timelines
For each graph you can select the number of days worth of data you wish to display. Then hit “Go” to load this up.
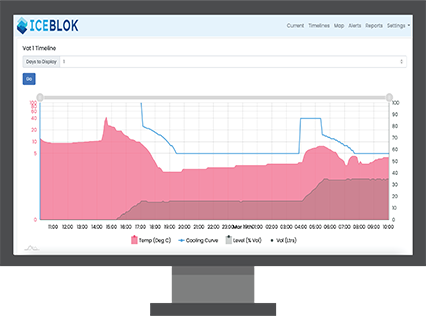
From here, you can see the current storage volume and any times where production is happening. Pickups are also visble on this timeline. You can highlight and drill into any section on the graph for a more detailled analysis. If you mouse over any point fo the graph it will reveal every data point and the detail contained within those data points.Timelines can also be viewd by Asset. To reach this page, simply click on the Asset Tab within the Timelines dashboard. This shows the current cooling profiles, the current vat volumes, and any milk that is currently held within that VAT. The timeline on this page also shows the cooling curve, which shows us if the milk is meeting the industry standard for cooling. You can toggle the visbility of the graph information for more simplistic views. Again, this graph can be analyzed by datapoint by dragging the mouse over any point on the graph.
As you can see below, you can drill into a lot of detail on this timelines tab. Once you have a timeline loaded use your cursor to show more detailed data about any specific data point on the graph. Drag your mouse over a particular section of the timeline to view that section of time in more
Alerts
Alerts can be configured according to your needs. There is a wide range of alert types and cascade options. Our team is also happy to help you get these alerts configured correctly.
The alerts can be acknowledged, comments and attachements can also be added. This makes communication incredibly simple and quick. There are a range of different alert types that can be set up including: temperature, vat state, heat exchanger, weather alerts and logistics pickup etc. These alerts can be configured to be sent out via email, text or by activating a physical alarm onsite.
Certain time restrictions can be setup on important alerts to ensure they are handled. Alerts can be sent to multiple people, in a sequence or at various intervals. Alerts can then be acknowledged and notes, documentation and images attached as required.
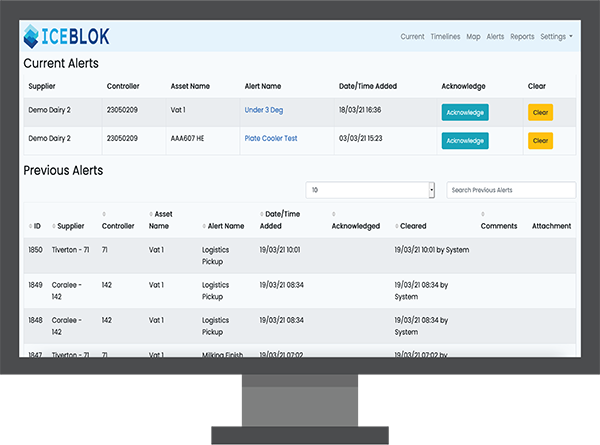
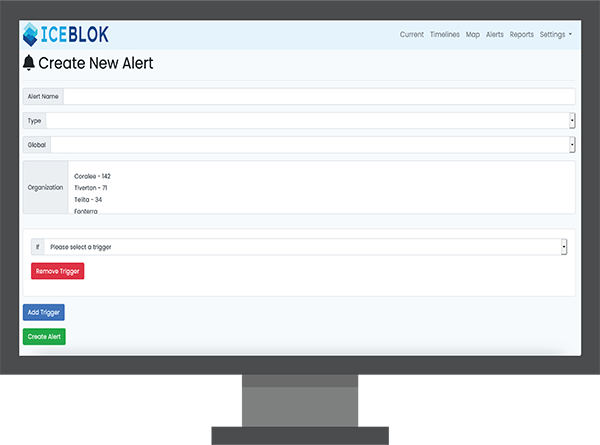
When you first load the alerts screen, any current alerts will appear at the top. These can be acknowledged for cleared. Then underneath that you will see a list of your previous alerts. You can also use the grey number bar to select how many alerts to show on the page. You can also search directly for a specific alert in the search bar next to this. Creating new alerts is done under Setting –> Alerts –> Add Alert (Green button at the bottom). However, it is important that these new alerts are setup carefully so that they are correct. To view your current alert types that have already been configured you go to Setting –> Alert Types. Similarly, you can setup a new alert type by clicking the green “Add Alert Type” button toward the bottom of the page.
There is a great level of detail that can be configured with the alerts. It is, however, important that these are setup correctly. This will then make the information provided by the alerts far more accurate and valuable.
Reports
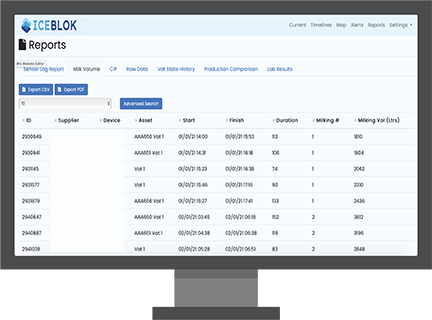
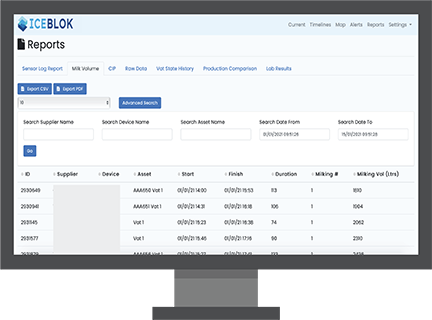
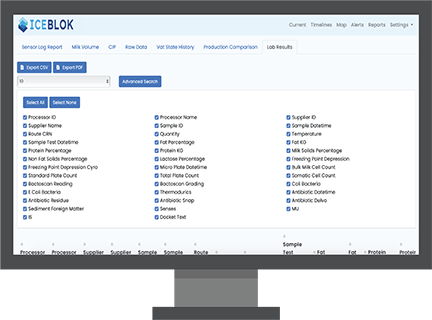
The reports section gives you access to a lot of important information, in one single place. To access the reports, simply click on “Reports” in the top menu bar on your device. This will then give you tab options for: Sensor Log Report, Milk Volume, CIP, Raw Data, Vat State History, Product Comparison & Lab Results. Within each of these you can then also set custom date ranges to view the information and generate the report you need.
This report information can also be exported if you need. Once a date range is selected, the report will generate. From there, you will be able to see all of the data on the screen. Toward the top right of the screen there are two blue buttons you can use to export the report in CSV or PDF format.This makes documenting, emailing or sharing the reports very simple.
There is also an advanced search button above the report you can click on to refine your search results more specifically. This includes specific suppliers, device names, asset names, and again, date. The grey bar under the blue export buttons also allows you to change how many sets of data are shown on one page. Please note, each report can take a moment to generate – especially when collecting a large amount of data, the loading is indicated by the blue spinning wheel. As with all other parts of the portal, the reports can be viewed on desktop, tablet or mobile.
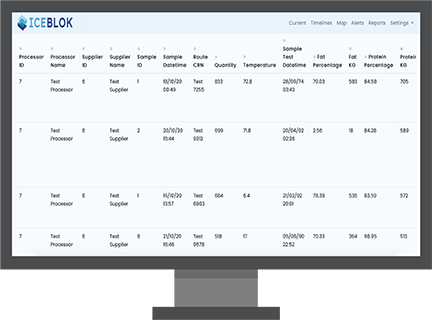
The Lab Results report allows you to see all of the information coming back from the lab analysis. This screen is incredibly useful as you can filter by certain metrics by simply clicking the blue tick box next to each metric type. This allows you to simplify a large amount of somewhat complex data to make understanding and analysing it a lot easier. You can also choose to select all and or select none with the blue buttons just ab